


 30 / 128

DAIRYING IN GUJARAT
A Statistical Profile
2013
28
Part II:
LIVESTOCK CENSUS
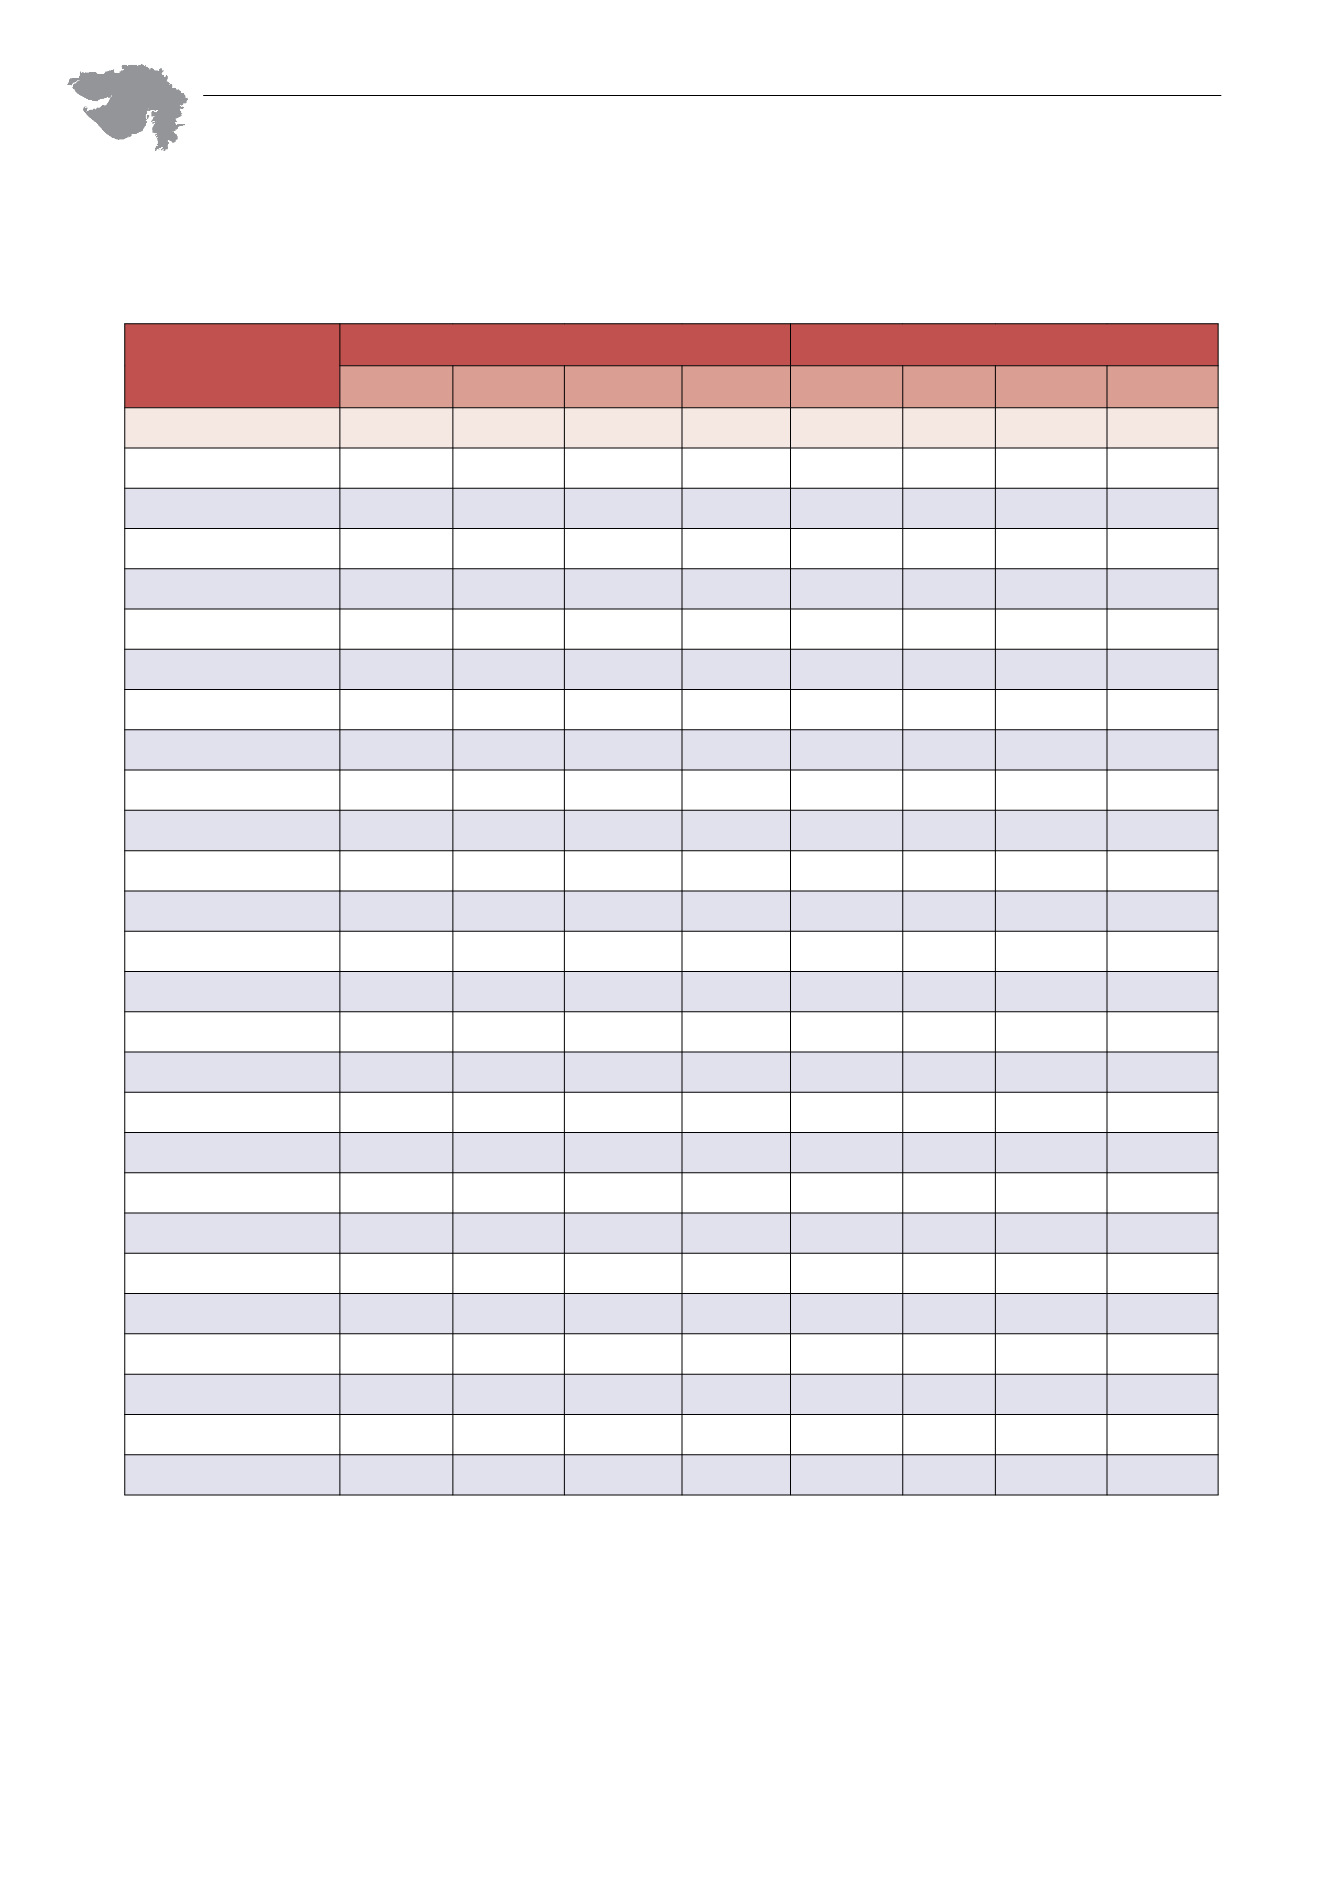
II.4. Livestock and Bovine Animal Density
TABLE II.4.1: District-wise Livestock and Bovine Density
Districts
Livestock
(No. per sq km)
Bovine
(No. per sq km)
1992 1997 2003 2007 1992 1997 2003 2007
GUJARAT
94
101
110
112
62
66
74
72
Ahmedabad
89
66
83
89
64
50
62
69
Amreli
102
110
98
100
65
66
58
63
Anand
176
222
144
188
Banaskantha
124
136
162
201
70
72
112
150
Bharuch
73
65
67
65
49
29
42
42
Bhavnagar
103
104
118
114
53
54
64
68
Dahod
307
391
199
239
Gandhinagar
186
172
233
272
156
141
201
237
Jamnagar
60
64
70
71
33
35
40
43
Junagadh
96
88
110
116
74
69
86
97
Kachchh
31
36
33
37
10
12
11
13
Kheda
157
175
201
240
132
142
163
203
Mehsana
130
169
172
205
103
142
146
179
Narmada
122
99
84
73
Navsari
176
150
127
117
Panchmahals
230
201
312
323
159
143
223
231
Patan
90
116
59
86
Porbandar
101
105
73
82
Rajkot
104
102
110
111
58
59
64
73
Sabarkantha
170
187
227
248
121
140
172
189
Surat
102
118
137
77
80
90
106
62
Surendranagar
65
68
77
92
38
42
47
61
Tapi
222
The Dangs
71
71
88
77
11
11
15
12
Vadodara
138
140
159
168
144
150
279
311
Valsad
163
144
151
186
118
99
106
133
SOURCE: Estimated from 15
th
, 16
th
, 17
th
and 18
th
Livestock Census, Department of Animal Husbandry, Dairying and Fisheries, Ministry of Agriculture,
Govt of India.