


 118 / 147

113
Part VI :
Feed Resources
National Dairy Development Board
Dairying in MAHARASHTRA
A Statistical Profile
2015
VI.1. Feed Resources - Availability vs. Requirement
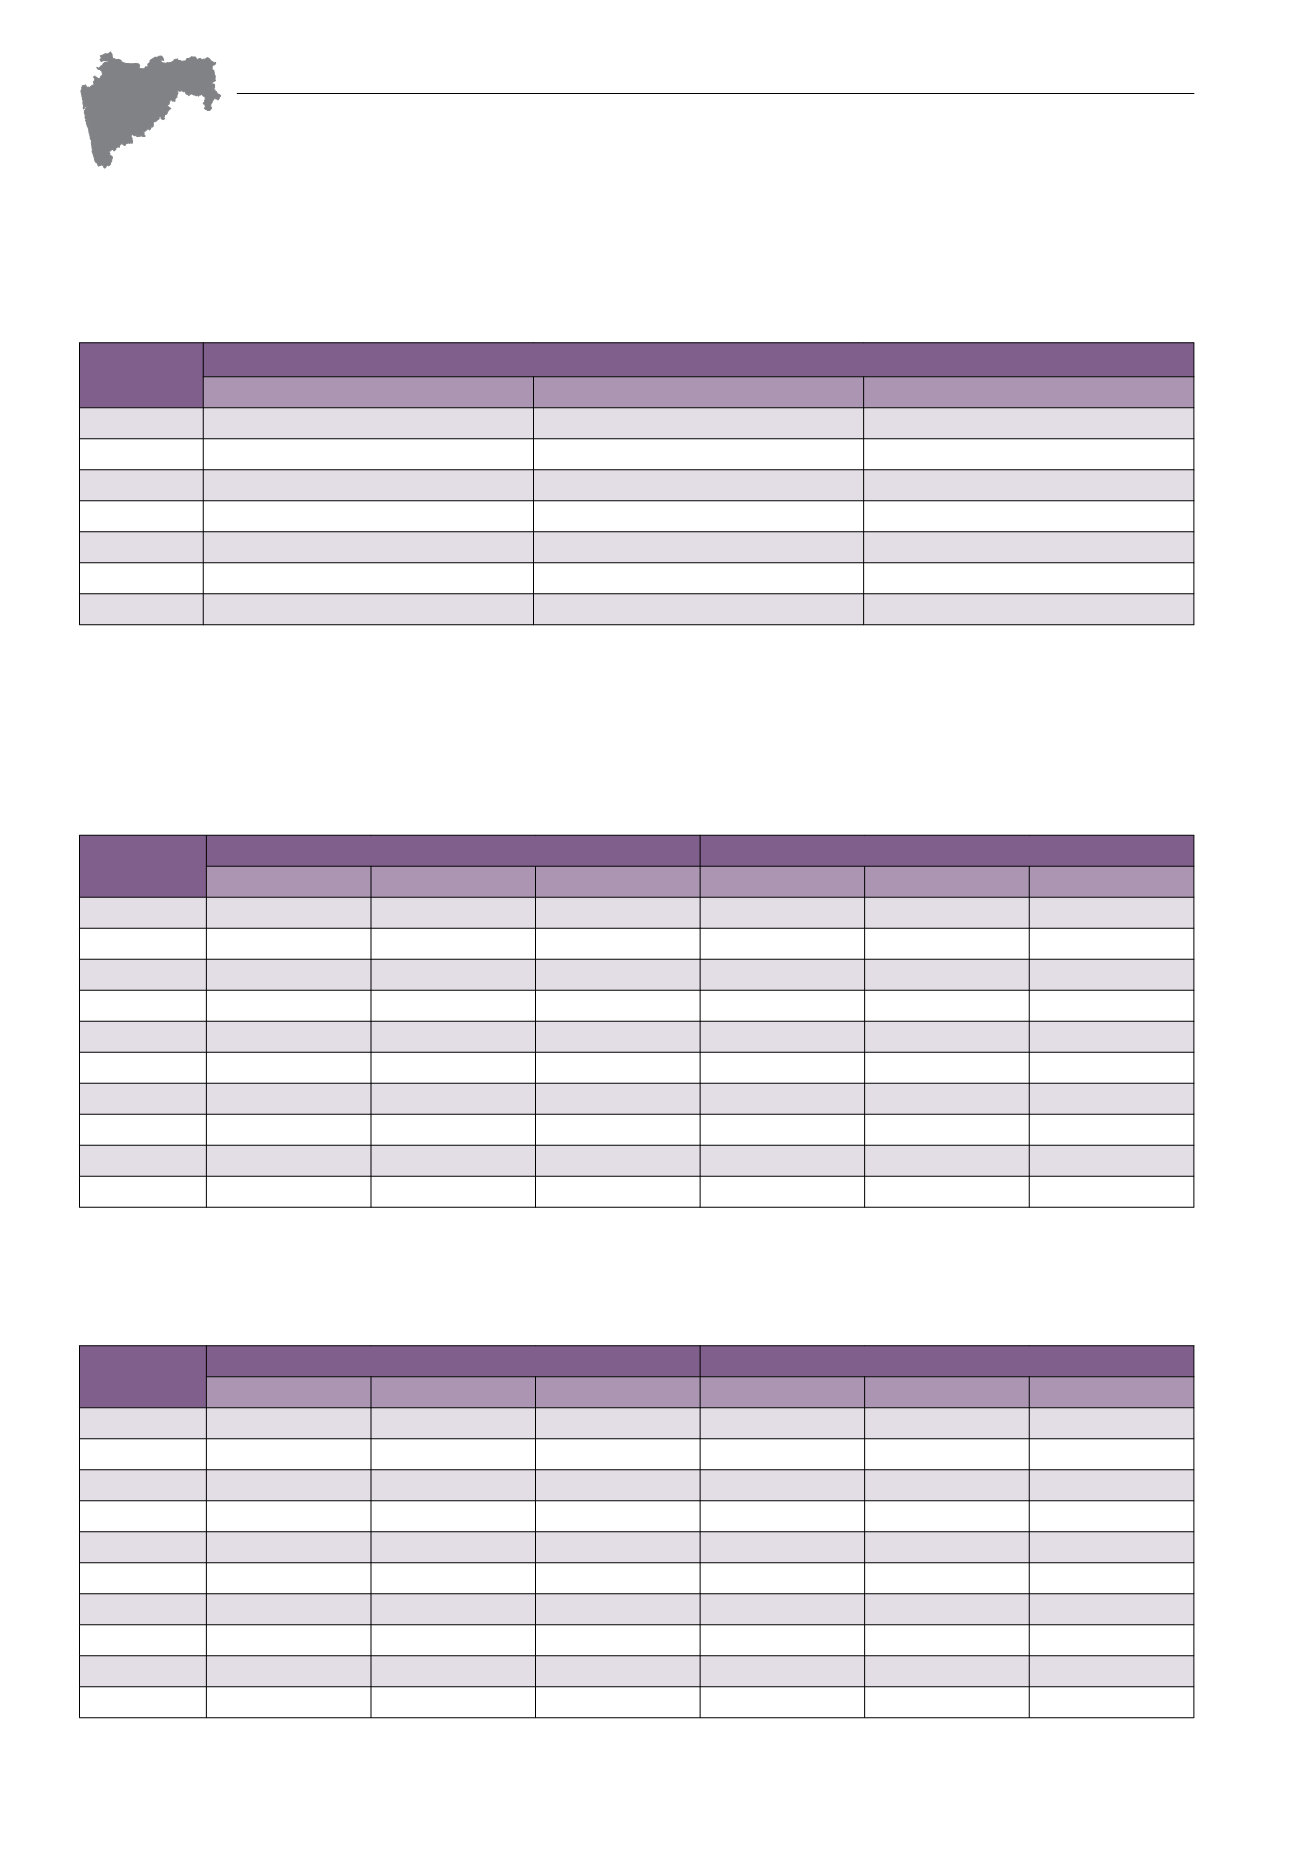
Table VI.1.2: Availability, Requirement and Surplus/Deficit of Feed Nutrient
Year
Dry Matter
(‘000 MT)
Availability
Requirement
Surplus/Deficit
1997
37,847
63,884
-26,037
2003
42,830
60,478
-17,648
2007
47,303
62,291
-14,989
2008
47,576
62,666
-15,090
2009
47,526
63,100
-15,574
2010
47,863
63,597
-15,733
2011
58,621
64,160
-5,539
Source: Feedbase 2012, National Institute of Animal Nutrition and Physiology, Bangalore.
VI.2. Feed Resources - Consumption
Table VI.2.1: Year-wise Feed Consumption – Cattle
(kg/animal/day)
Year
In-Milk Animal
Dry Animal
(Including Not Calved even Once)
Green Fodder Dry Fodder Concentrate Green Fodder Dry Fodder Concentrate
1992-93
3.196
5.476
0.390
1.519
3.379
0.014
1997-98
4.692
5.614
0.862
2.538
3.488
0.105
2003-04
4.178
5.605
0.628
2.156
3.520
0.074
2007-08
4.528
7.185
0.692
2.695
5.484
0.095
2008-09
5.024
7.541
0.900
3.263
5.541
0.609
2009-10
4.867
7.702
1.063
3.301
5.784
0.502
2010-11
5.080
7.625
0.981
3.265
5.665
0.554
2011-12
5.024
7.541
0.900
3.263
5.541
0.609
2012-13
7.718
6.022
1.730
4.695
6.048
0.676
2013-14
6.809
6.458
1.723
5.018
5.796
0.884
Source: Integrated Sample Survey Reports, Department of Animal Husbandry, Govt. of Maharashtra.
Table VI.2.2: Year-wise Feed Consumption – Buffalo
(kg/animal/day)
Year
In-Milk Animal
Dry Animal
(Including Not Calved even Once)
Green Fodder Dry Fodder Concentrate Green Fodder Dry Fodder Concentrate
1992-93
4.101
7.002
1.084
2.830
5.391
0.048
1997-98
5.468
5.761
1.698
2.876
3.666
0.109
2003-04
5.872
6.768
1.823
2.829
4.953
0.092
2007-08
7.767
9.570
1.603
3.905
6.680
0.070
2008-09
7.860
9.092
1.909
4.467
8.349
0.432
2009-10
7.767
9.106
2.214
4.678
6.580
0.213
2010-11
7.993
9.133
2.061
4.620
6.622
0.323
2011-12
7.860
9.092
1.909
4.467
8.349
0.432
2012-13
8.993
7.911
1.937
5.774
7.211
0.951
2013-14
8.930
9.886
2.341
5.735
7.784
1.169
Source: Integrated Sample Survey Reports, Department of Animal Husbandry, Govt. of Maharashtra.