
21
Part II :
Livestock Census
National Dairy Development Board
Dairying in MAHARASHTRA
A Statistical Profile
2015
II.1. Animal Population
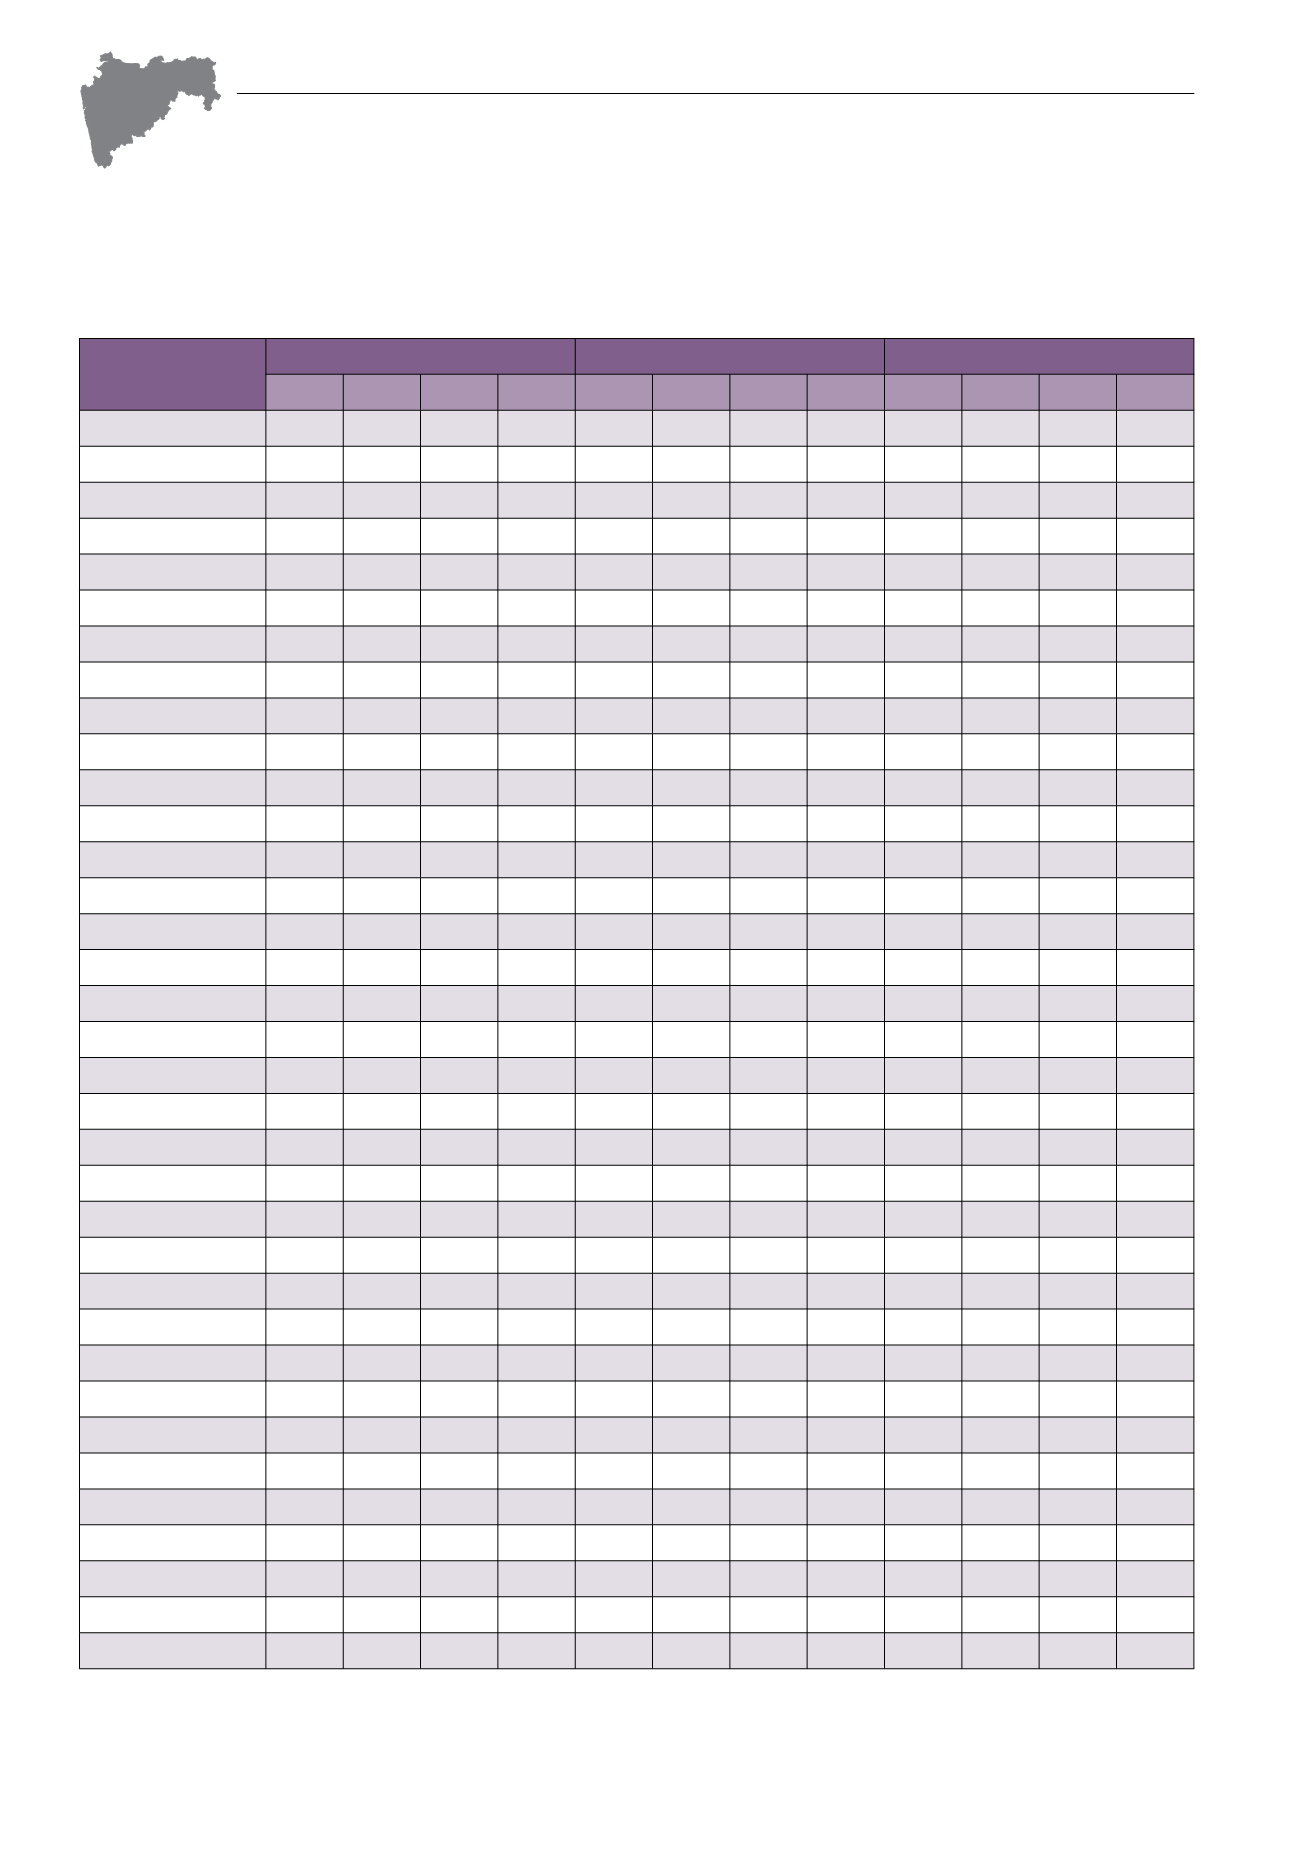
Table II.1.2: District-wise Total Bovine Population
Districts
Indigenous Cattle
(‘000)
Crossbred Cattle
(‘000)
Buffalo
(‘000)
1997 2003 2007 2012 1997 2003 2007 2012 1997 2003 2007 2012
MAHARASHTRA 15,615 13,527 13,061 11,833 2,457 2,776 3,122 3,651 6,073 6,145 6,072 5,594
Ahmadnagar
762 582 565 545 516 675 818 882 173 192 241 221
Akola
642 284 271 254 26 19 15 15 149 66 63 49
Amravati
563 496 473 489 28 28 28 47 128 120 124 125
Aurangabad
503 410 415 416 110 113 115 167 102 83 99 94
Bhandara
704 228 210 157 47 43 52 82 191 90 96 90
Bid
528 471 494 451 96 124 174 131 188 209 258 240
Buldana
507 470 495 427 44 49 61 53 122 130 153 120
Chandrapur
650 584 559 492 12 20 19 24 114 108 87 73
Dhule
766 311 314 316 75 41 47 41 207 96 104 100
Gadchiroli
600 536 645 501
3
4
6
7 95 86 119 76
Gondiya
376 372 315
13 14 22
102 99 88
Hingoli
278 268 260
19 13 16
80 82 66
Jalgaon
639 517 487 466 84 86 68 86 363 331 301 257
Jalna
440 594 369 371 32 35 35 43 86 226 86 79
Kolhapur
176 150 124 102 85 112 129 173 655 662 642 613
Latur
360 354 343 337 35 33 26 24 229 246 257 233
Mumbai
4
5
1
2
2
3
1
3 78 76 23 30
Nagpur
576 470 448 369 64 79 88 100 98 88 100 84
Nanded
699 642 641 635 33 25 17 15 260 258 249 212
Nandurbar
420 405 322
16 14 15
102 95 72
Nashik
1,011 832 799 752 164 167 177 264 262 232 242 238
Osmanabad
303 277 256 215 77 96 119 140 148 166 170 173
Parbhani
739 322 382 350 26 14
8
7 203 102 139 97
Pune
508 341 367 307 388 377 417 456 287 245 300 294
Raigarh
443 380 289 214
9 10
8 10 147 128 75 69
Ratnagiri
552 456 386 300 29 26 15 19 95 62 50 44
Sangli
225 207 182 170 52 64 98 171 468 527 519 493
Satara
312 217 200 182 153 157 158 195 361 358 347 353
Sindhudurg
220 189 167 134
9 11
10 13 105 90 80 67
Solapur
465 441 408 390 182 230 277 340 325 389 408 450
Thane
552 478 444 398
9 12 10 12 223 214 193 187
Wardha
374 304 294 258 50 45 56 46 68 65 63 49
Washim
170 291 234
9
7
9
74 77 63
Yavatmal
792 738 697 698 21 22 21 22 143 144 131 96
Source: 16
th
, 17
th
, 18
th
and 19
th
Livestock Census, Department of Animal Husbandry, Dairying and Fisheries, Ministry of Agriculture & Farmers Welfare,
Govt. of India.
Note: Mumbai and Mumbai Suburban districts data are merged.


