


 7 / 136

2
National Dairy Development Board
Dairying in Karnataka
A Statistical Profile
2015
Part I :
General Statistics
I.1. Karnataka at a Glance
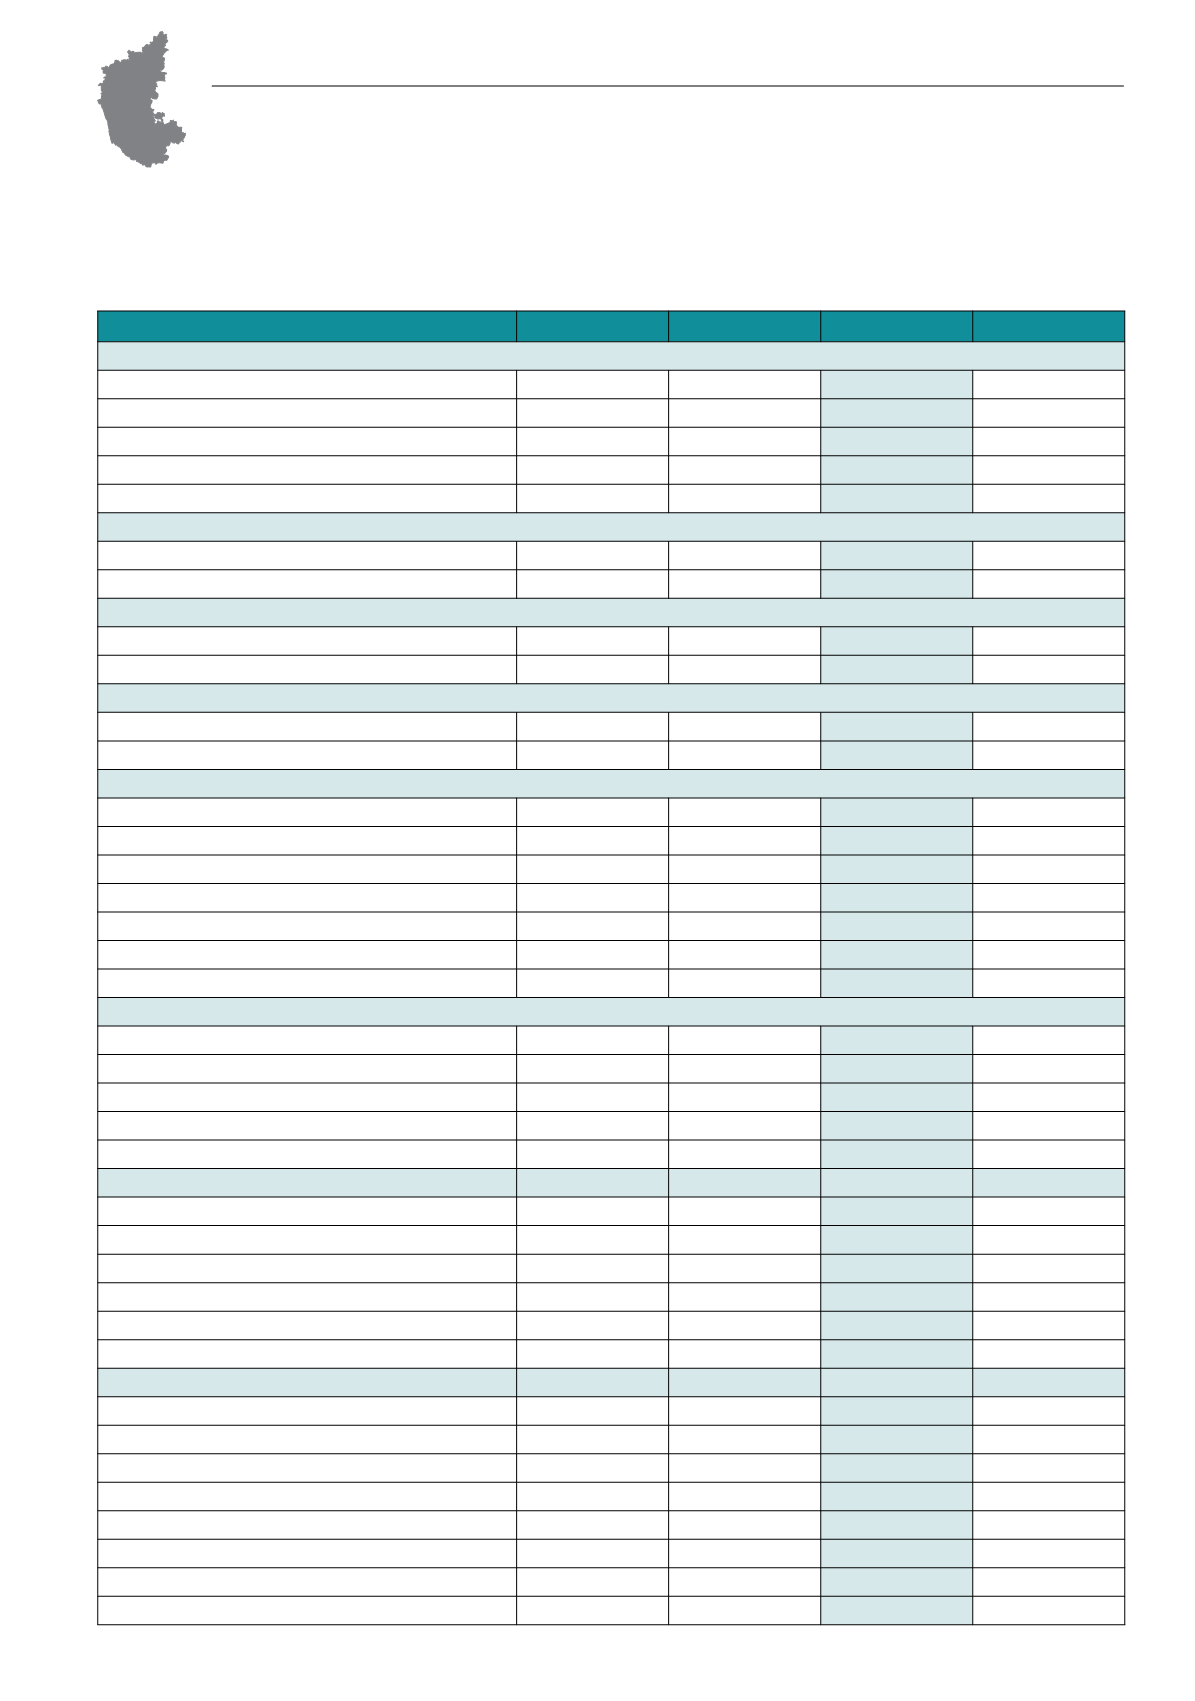
TABLE I.1.1: General Statistics: Karnataka vs. India
Particulars
Unit
Year
Karnataka
India
State Geography & Rural Infrastructure
Geographical area
‘000 sq km 2012
191.8
3,287.3
Districts
Nos
2011
30
640
Talukas
‘’
‘’
176
5,924
Villages
‘000
‘’
29
640.9
Households
Million
‘’
13.3
249.4
Rural Households
2001
‘000
2001
6,726
137,414
2011
‘’
2011
7,947
168,565
Rural Households with Electricity
2001
%
2001
72
44
2011
‘’
2011
86
55
Rural Households with Tap water supply
2001
%
2001
48
24
2011
‘’
2011
56
31
Human Population
Population
Millions
2011
61.1
1,210.1
Urban (As % of total)
%
‘’
39
31.2
Rural (As % of total)
‘’
‘’
61
68.8
Density of Population
per sq. km
‘’
319
382
Scheduled Castes (As % of total)
%
‘’
17.1
16.6
Scheduled Tribes (As % of total)
‘’
‘’
7.0
8.6
Sex Ratio
Ratio
‘’
973
943
Literacy Rate (excluding population of 0 to 6 age group)
Male
%
2011
82.5
80.9
Female
‘’
‘’
68.1
64.6
Urban
‘’
‘’
86.2
84.1
Rural
‘’
‘’
68.9
67.8
Per Capita Income (at current prices)
`
2012-13
77,015
69,585
Livestock Population
million
2012
27.7
512.0
Bovine
‘’
‘’
13.0
299.9
Indigenous Cattle
‘’
‘’
6.6
151.2
Crossbred Cattle
‘’
‘’
2.9
39.7
Buffaloes
‘’
‘’
3.5
108.7
Small Ruminants
‘’
‘’
14.4
200.2
Poultry
‘’
‘’
53.4
729.2
Livestock Population
million
2007
30.8
529.7
Bovine
‘’
‘’
14.8
304.8
Indigenous Cattle
‘’
‘’
8.3
166.0
Crossbred Cattle
‘’
‘’
2.1
33.1
Buffaloes
‘’
‘’
4.3
105.3
Small Ruminants
‘’
‘’
15.7
212.1
Poultry
‘’
‘’
42.1
648.9
Number of Major Cattle Breeds
nos
2012
6
30
Number of Major Buffalo Breeds
“
‘’
1
12