


 8 / 136

3
National Dairy Development Board
Dairying in Karnataka
A Statistical Profile
2015
Part I :
General Statistics
I.1. Karnataka at a Glance
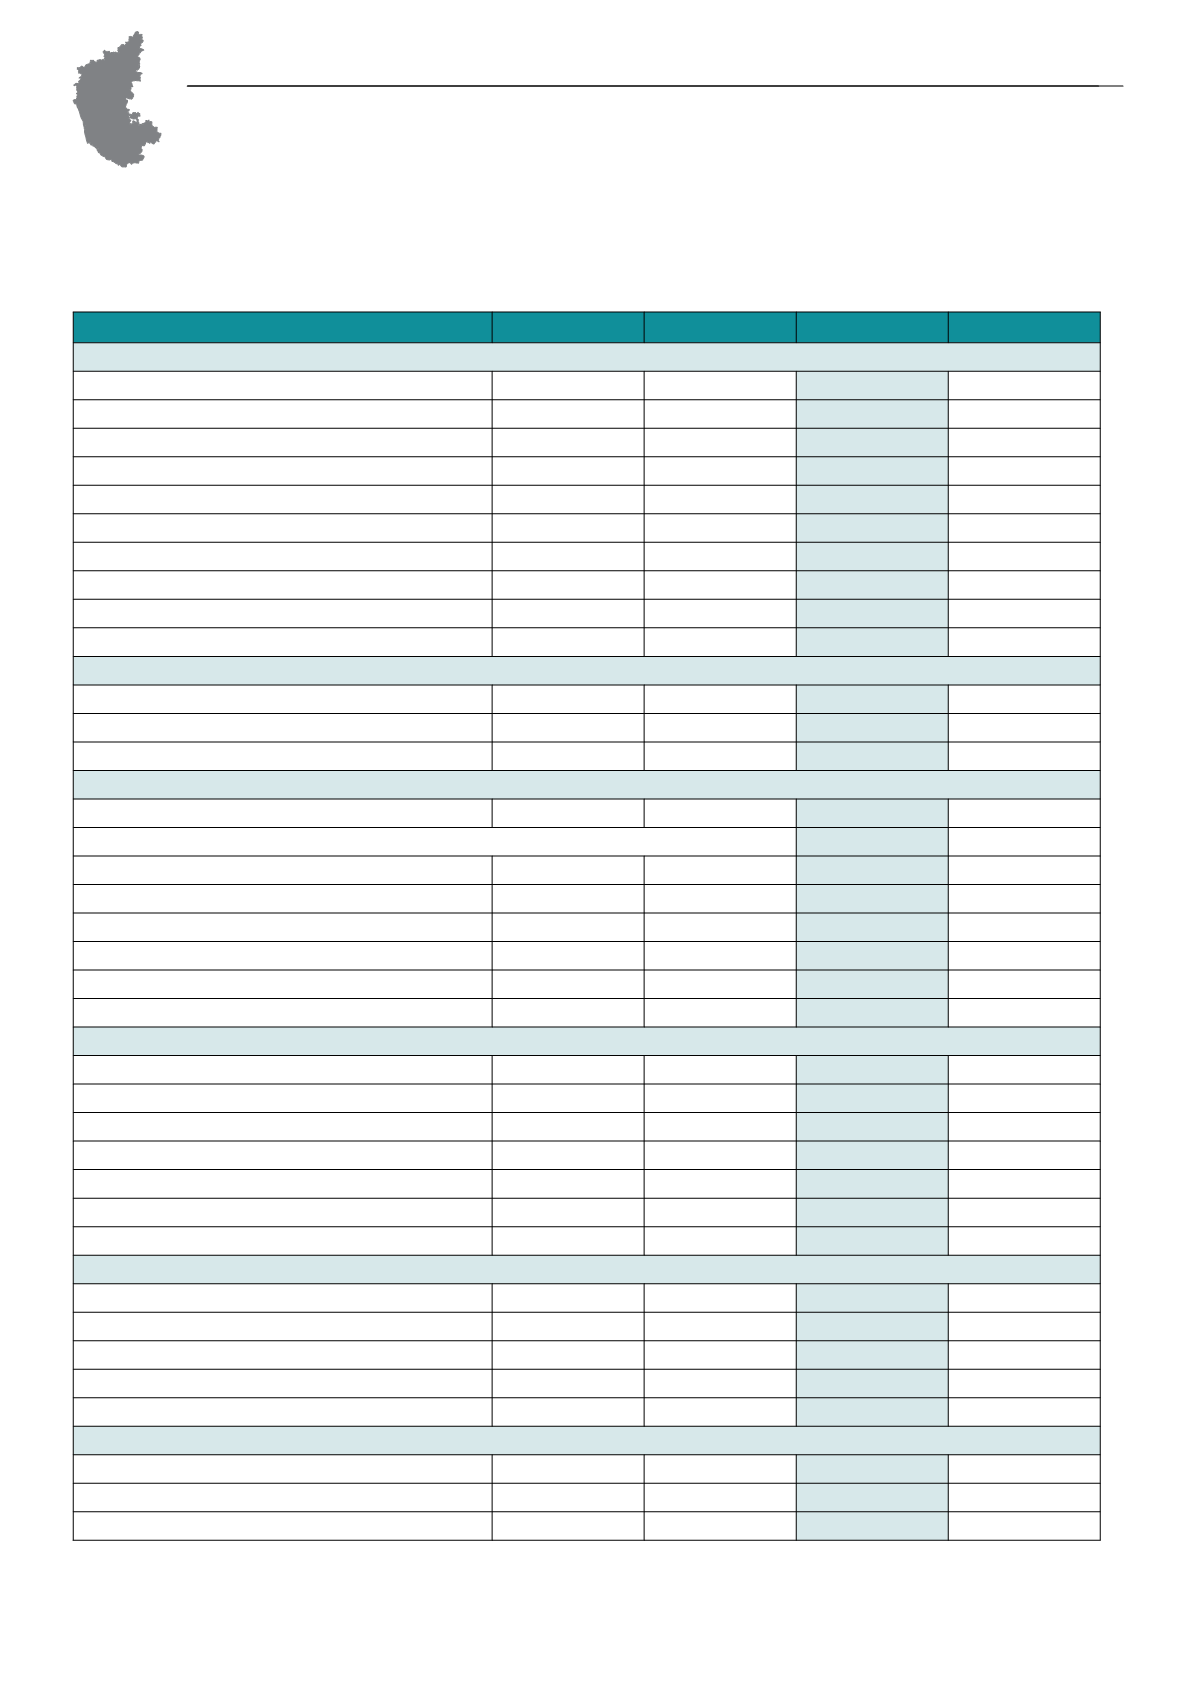
TABLE I.1.1: General Statistics: Karnataka vs. India
Particulars
Unit
Year
Karnataka
India
Livestock Production
Milk Production - Total
‘000 MT
2013-14
5,997
137,686
Crossbred Cattle
‘’
‘’
2,703
33,154
Indigenous Cattle
‘’
‘’
1,439
28,104
Buffaloes
‘’
‘’
1,795
70,109
Goats
‘’
‘’
60
4,983
Per Capita Milk Availability (estimated)
grams/day
‘’
261
302
Egg Production
million
‘’
4,130
73,438
Estimated Meat Production
‘000 MT
‘’
170
6,235
Marine & Inland Fish Production
‘’
‘’
492
9,426
Wool Production
‘000 Kg
‘’
7,754
47,909
Veterinary Infrastructure
#
Veterinary Institutes
nos
2012-13
3,680
59,159
Semen Stations
‘’
2011-12
5
54
AI Centers (Govt)
‘’
2012-13
3,910
77,765
Veterinary Services
AI Done (Govt)
‘000
2012-13
2,368
41,165
Vaccination Done
H.S. Vaccination
‘’
2012-13
8,859
B.Q. Vaccination
‘’
‘’
534
FMD Vaccination
‘’
‘’
19,208
Total Bovine
‘’
‘’
28,601
Treatment
‘’
‘’
6,806
Castration
‘’
‘’
223
Agricultural Resources
Forest Cover
%
2011-12
16.1
21.30
Pasture and Grazing Land
‘000 ha
‘’
908
10,296
As %of total reporting area
%
‘’
4.8
3.4
Area Under Fodder Crops
‘000 ha
‘’
33
7,736
Gross Irrigated Area As %Gross Cropped Area
%
‘’
29
47
Cropping Intensity
%
‘’
121
139
Irrigation Intensity
%
‘’
120
140
Production of Major Crops
Cereals
‘000 MT
2012-13
9,604
238,792
Pulses
‘’
‘’
1,259
18,342
Oilseeds
‘’
‘’
919
30,941
Sugarcane
‘’
‘’
35,732
341,199
Fodder Production
MMT
2008
35
933
GroundWater Status (2009 vs 2004)
Safe
% of Talukas
2009 & (2004)
57 (53)
73 (71)
Semi Critical
‘’
‘’
13 (8)
9 (10)
Critical
‘’
‘’
4 (2)
3 (4)